Operator Station (OPS)
Overview
The Operator Station (OPS) provides functions for plant operation and monitoring.
OPS includes the following functions.
- Display of graphics (system diagrams)
- Control loop plate (controller)
- Alarm Display
- Trend Display
- Logic computation status monitoring
Operator Station (OPS) Functions
Display of Graphics
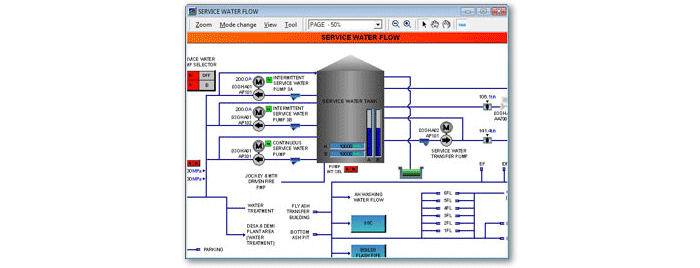
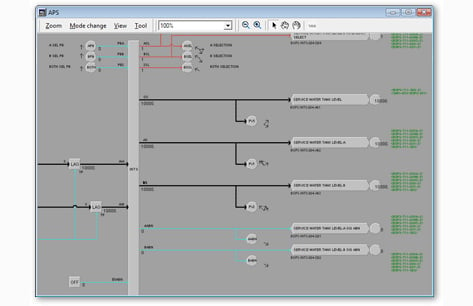
The graphics function to display the operational status of equipment.
The entire facility or partial system diagrams can be displayed, with the process status and process values shown in real-time. The display of multiple screens is supported to enable efficient operation.
In addition, related control loop plates and logic screens associated with a device shown on the system screen can also be displayed to support operation.
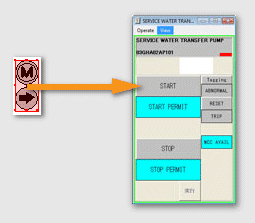
Call-up of Loop Plates
A loop plate (final control element) can be called up from an object on a graphic screen to enable immediate control.
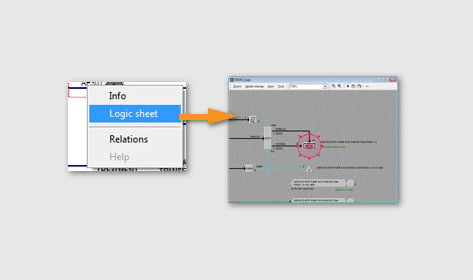
Call-up of Logic Sheets
Related control logic can be called up from figures and buttons on a graphic screen, allowing the details to be confirmed.
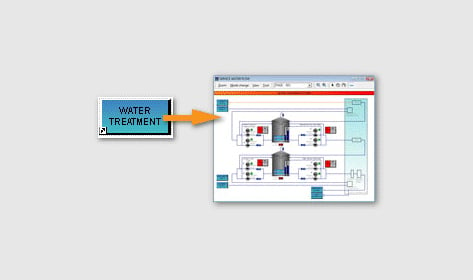
Call-up of Graphics (System Diagrams)
By registering other graphics to the buttons of the graphic display, related graphics can be called up.
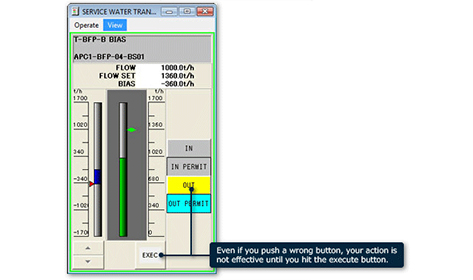
Control Loop Plate
A control loop plate provides device monitoring or control on an equipment screen.
The control loop plate allows actions such as modifying setting values or performing opening and closing operations. As control actions are not output until the Execute key is pressed after operations have been input, incorrect operation can be prevented.
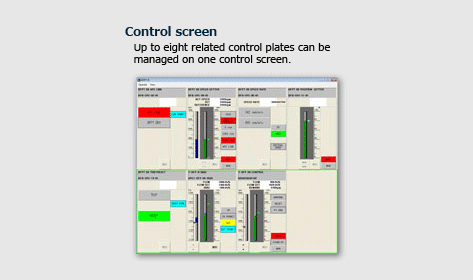
Control Screen
Up to eight related control plates can be managed on a single control screen.
Alarm Display
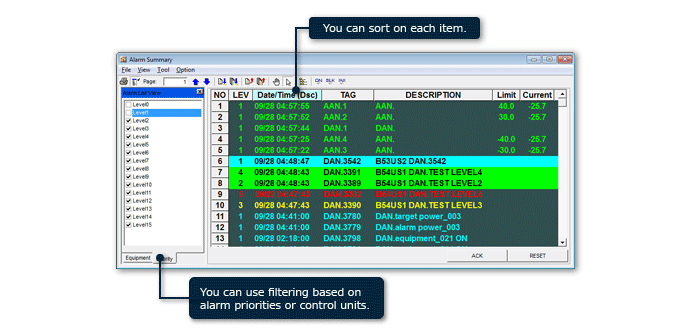
DIASYS Netmation alarms quickly communicate plant or control and monitoring system abnormalities to operators. Alarms can be configured to 15 levels of priority, and up to 160,000 items of generated event data can be accumulated and viewed.
Naturally, it is possible to immediately call-up the logic related to a triggered alarm to help identify the cause.
Trend Display
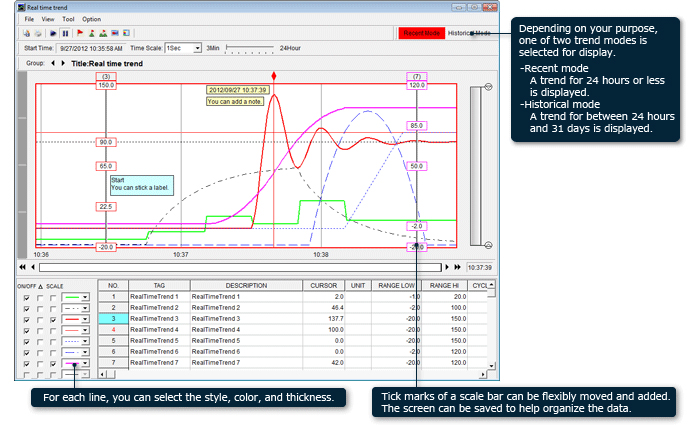
This function displays process changes in a graph format.
The trend display allows process data to be registered to the screen through simple drag-and-drop actions.
There are three types of trends that allow various analyses to be performed: trend graphs that monitor process data chronologically, X-Y trends that display the correlations between process data, and quick trends to display simple process data monitoring.
-
Affixing Notes
Notes can be affixed anywhere to retain comments.
In addition, this state can be saved and printed as-is. -
Timing Mark Display
Timing marks that describe time, comments or cross points can be displayed at any point on a trend graph.
In addition, this state can be saved and printed as-is. -
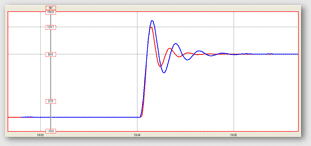
Comparison with Past Trends
Past trends can be saved in advance and compared with current trends.
-
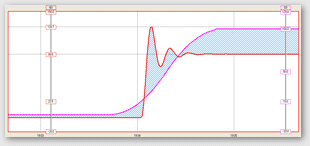
Displaying the Deviation of Two Trends
The deviation between two different trends can be easily displayed.
Other Trends
- X-Y Trend
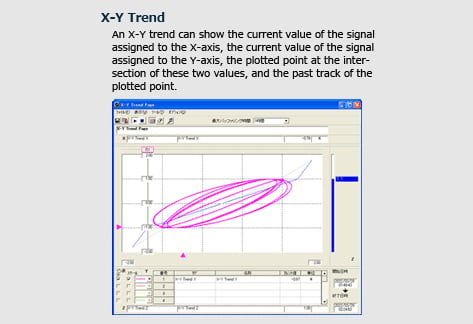
With an X-Y trend, the current values of signals registered to the X-axis and Y-axis, plot points representing intersections of the two points, and the locus of past plot points can be displayed.
- Bar Chart
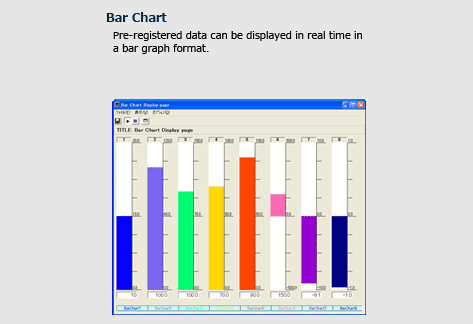
Pre-registered data is displayed in real-time in a bar graph format.
Logic Computation Status Monitoring
Status monitoring of logic computation running on a multiple process station (MPS) or compact process station (CPS) and parameter adjustments can be carried out on the Operator Station (OPS) screen.
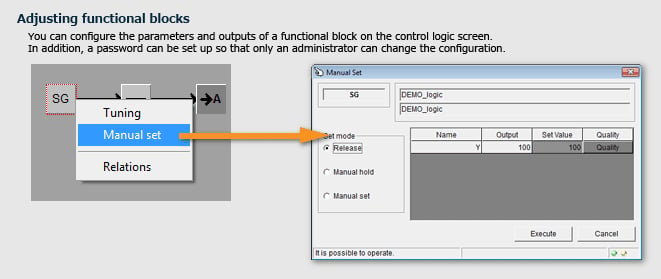
Function Block Adjustments
From the control logic screen, function block parameters and output settings can be configured.
In addition, operators other than administrators with password-protected accounts can be prevented from making changes.
Products
- GTCC
- Steam Power
- IGCC
- Geothermal
-
Gas Turbines
- Product Lineup
- Comparative Performance
-
Technical Information
- Gas Turbines for Mechanical Drive Applications
- Cutting-Edge Elemental Technology Producing 1600°C Class J Gas Turbines
- Development of High-Efficiency Gas Turbine Applying 1600°C Class J Technology
- Combustor Technologies Supporting Stable Operation
- Overview and Verification Status of T-Point 2 Demonstration Facility
- Comprehensive Efforts from Development to Manufacturing
- Summary of Orders
- Development History
- Product Selection Assistant (Middle & small Class)
- Aero-derivative Gas Turbines
- Steam Turbines
- Boilers
- Air Quality Control Systems (AQCS)
- Generators
-
Control Systems
- What is DIASYS?
- DIASYS Netmation
-
DIASYS Optional Products
- IR-S Infrared Flame Detector
- Net IR-S Infrared Flame Detector
- Rail Mounting Net IR-S
- Boiler Tube Leak Detector
- Shaft Vibration Analyzer
- Simulator
- Advanced Combustion Pressure Fluctuation Monitoring System (A-CPFM) / Combustion Pressure Fluctuation Monitoring System (CPFM)
- Multi-Coal Fired Boiler Optimum Control
- FXtoLS Adapter
- Fuel Cells
- Catalogue
- HIACS Series
- Technical Report


